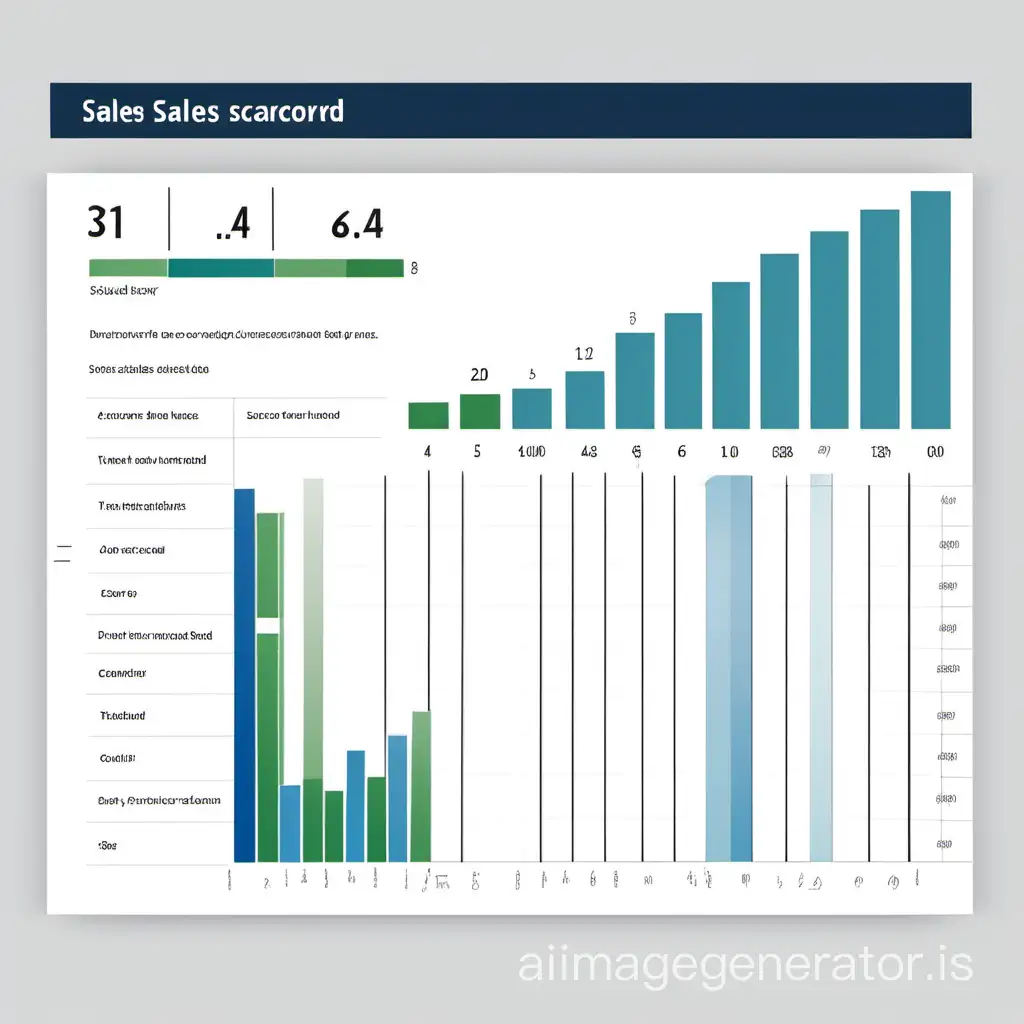
Salesman Scorecard with Bar Graph Visualization

Image Prompt
Prompt
sales man scorecard add bar graph
Model: normal
Ratio: 1:1
Related AI Images


Related Tags
Prompt Analyze
- Subject: The central focus of the image is a salesman scorecard, depicting metrics and performance indicators. Setting: The setting could be an office or a business environment, with a clean and professional backdrop to emphasize the importance of the scorecard. Background: The background might include elements like desks, computers, and other office paraphernalia, indicating a corporate atmosphere. Style/Coloring: The style could be modern and sleek, with vibrant colors to highlight important data points on the scorecard. The use of a bar graph adds visual interest and clarity to the performance metrics. Action: The action in the image revolves around analyzing or presenting the sales data, with perhaps a person pointing to or discussing specific sections of the scorecard. Items: Key items in the image include the scorecard itself, a bar graph representation, pens or markers for annotations, and possibly electronic devices like tablets or laptops for data entry or presentation. Costume/Appearance: The individuals in the image might be dressed in business attire, projecting a professional demeanor suitable for a corporate setting. Accessories: Accessories could include office supplies like notebooks, calculators, and folders, as well as presentation aids like pointer sticks or laser pointers.