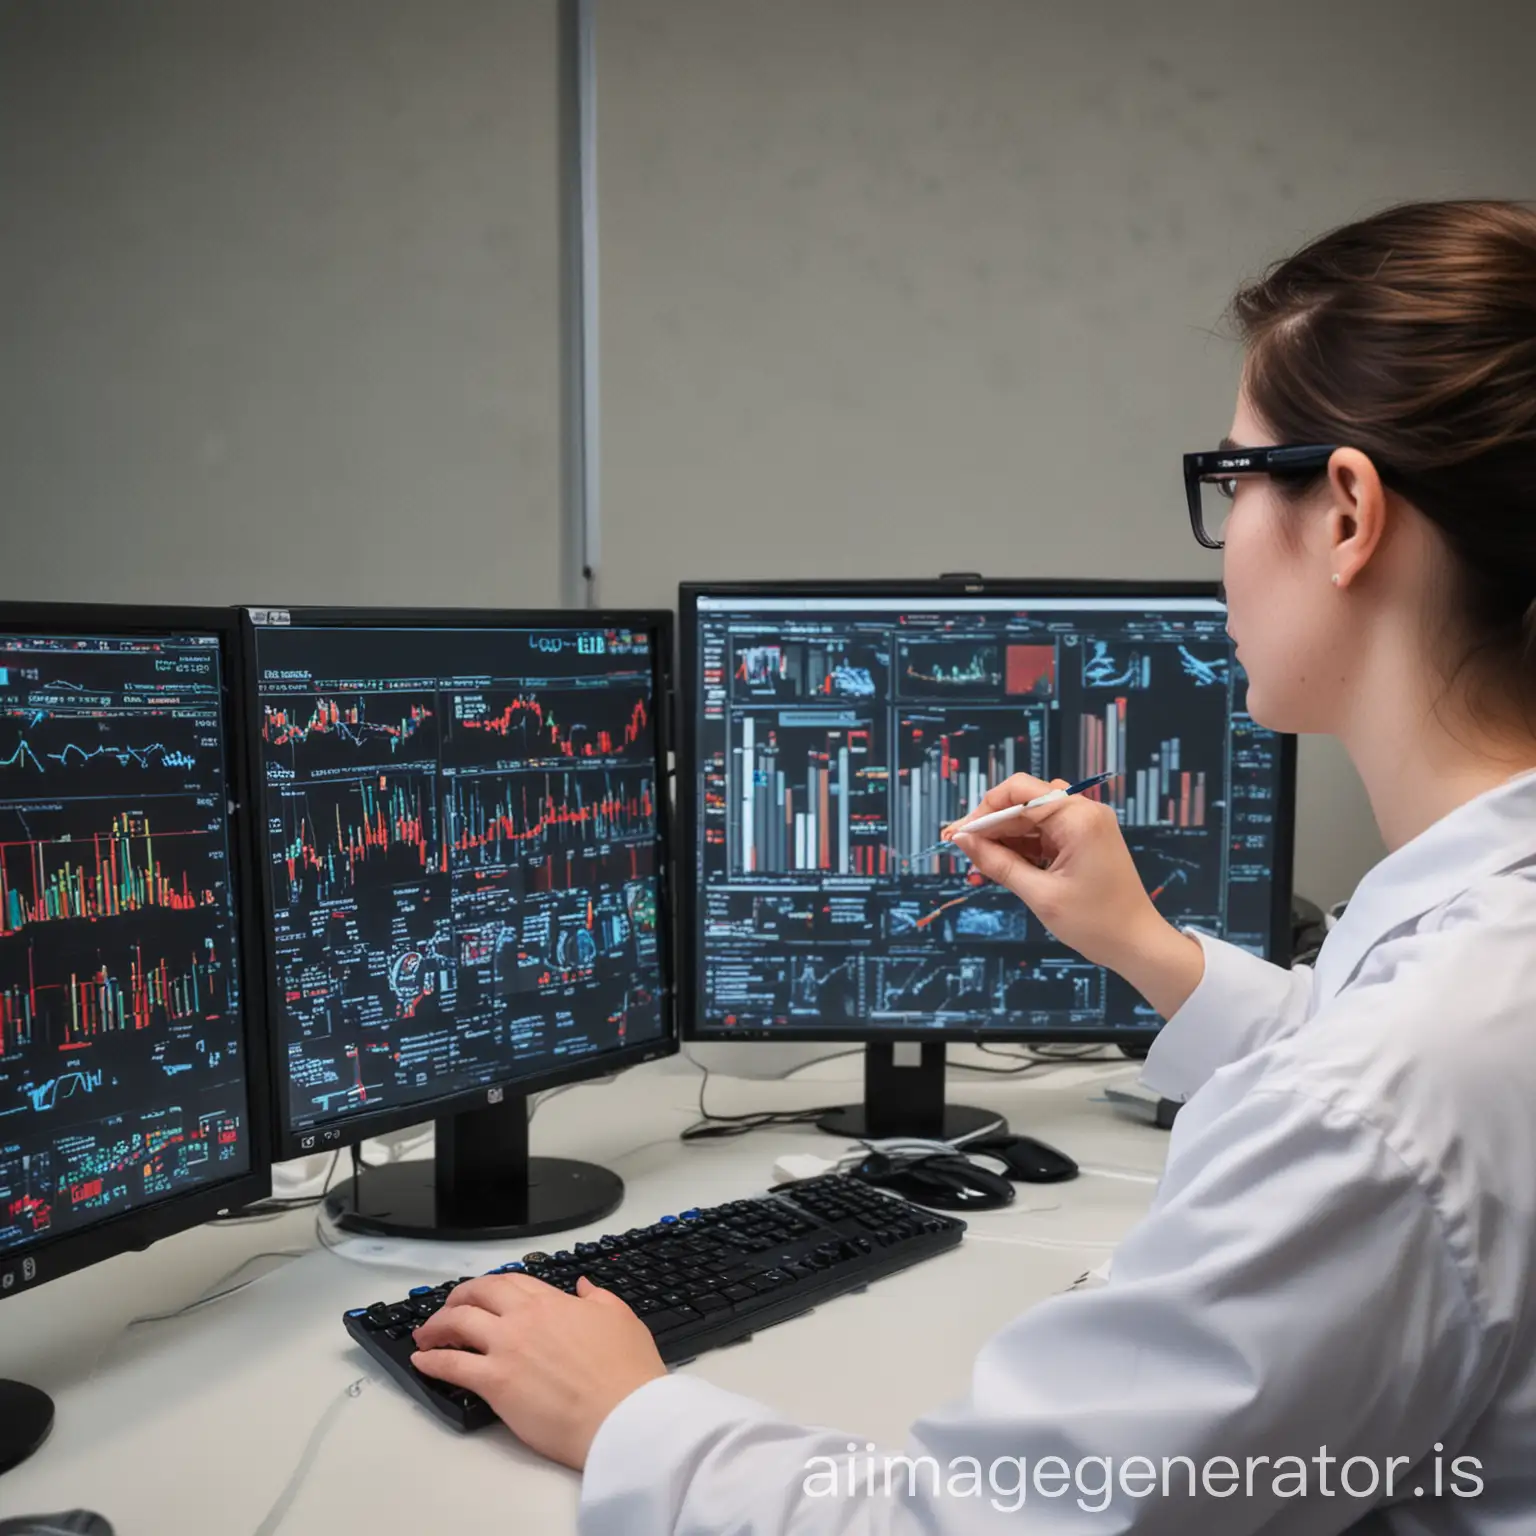
Interactive Data Analytics Course with Diverse Students Analyzing Data Trends
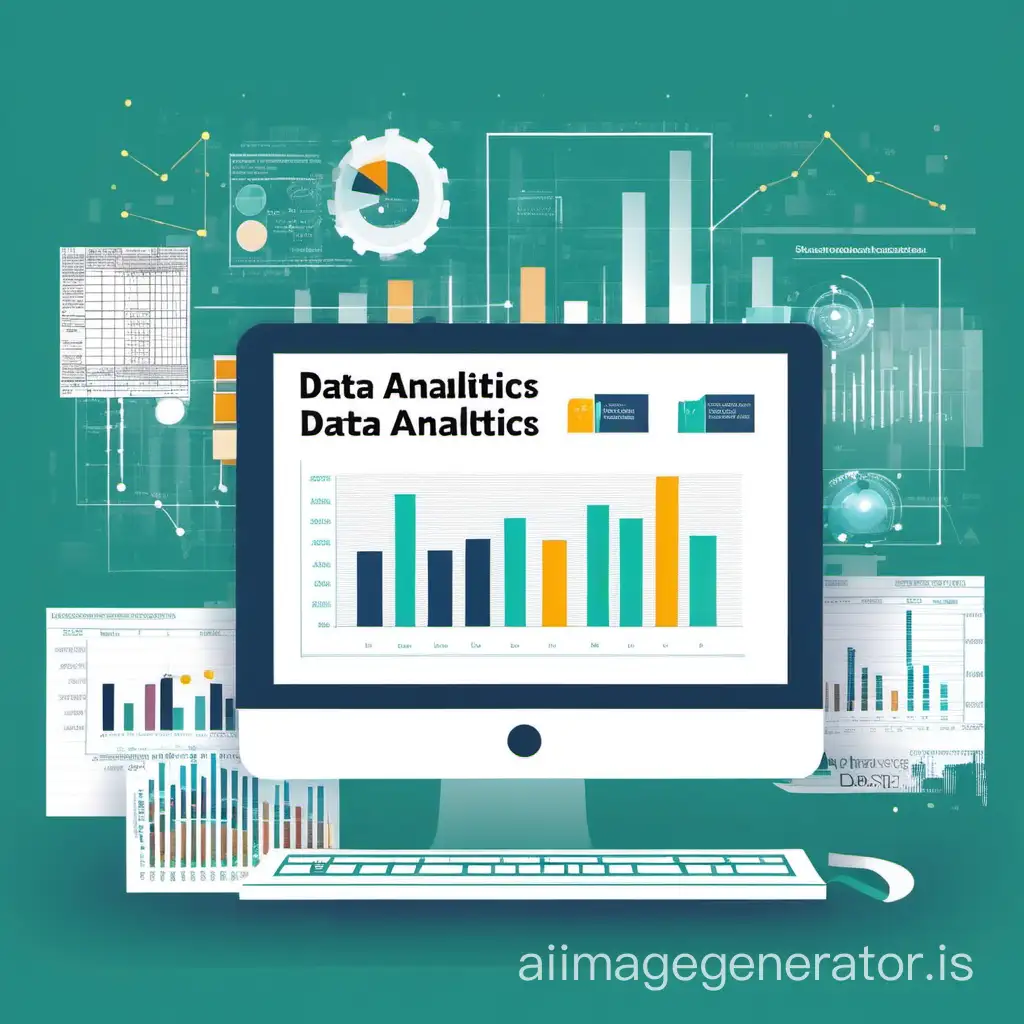
Data analytics course

Image Prompt

Prompt

Data analytics course
Model: normal
Ratio: 1:1
Open in editor
Download
Share To

Related AI Images

analyzing and visualizing data in the life sciences field
black mechanical octopus computer monitor data and metrics in analytics and administration
A decent digital banner of data science startup offering services like analytics , chatbot , machine learning
Technology tools in educational supervision  🔹 Learning management systems such as: Moodle, Blackboard, Google Classroom to monitor the performance of teachers and students.  🔹 Virtual meeting applications such as: Zoom, Microsoft Teams, Google Meet to hold remote meetings.  🔹 Educational data analysis platforms such as: Power BI, Google Analytics to analyze the performance of students and teachers and make informed decisions.  🔹 Interactive assessment tools such as: Kahoot, Mentimeter, Quizizz to enhance participation in educational training.  🔹 Artificial intelligence in educational supervision: using audio-visual analysis to monitor classroom teaching performance and provide customized advice based on educational data analysis.
Side profile of a doctor analyzing healthcare AI data hologram. Holographic artificial intelligence in health care amp medicine. Medical research innovation
AI cyber security threat illustration, female IT specialist analyzing data information technology, augmented reality artificial intelligence collage, side profile, copy space
Create a high-tech digital marketing environment. Visualize a sleek, modern workspace with holographic social media icons floating around, interactive data analytics graphs on transparent screens, and a team of professionals collaborating using augmented reality tools. The scene should convey a sense of innovation, connectivity, and creativity in a business setting.
Electric Vehicle Power Battery Traceability;Voltage Data;Temperature Data;Current Data

Prompt Analyze

  • Subject: The main subject of the image is an interactive data analytics course. This could feature a classroom or workshop setting with students engaged in data analysis activities. Background/Setting: The background could depict a modern classroom or computer lab environment, with desks, computers, and screens displaying data visualization tools or graphs. It may include elements that convey a collaborative learning atmosphere. Style/Coloring: The style could be modern and dynamic, with vibrant colors to represent the energy and excitement of learning. Bright and stimulating colors could be used to highlight key elements such as charts or graphs. Action/Items: Students could be shown actively participating in data analysis tasks, such as discussing findings, working on laptops, or presenting insights. Data-related items such as charts, graphs, laptops, and textbooks could be prominently featured. Costume/Appearance: Students could be depicted in casual attire or business casual clothing suitable for a classroom or professional setting. The instructor could be shown in professional attire to convey authority and expertise. Accessories: Accessories such as pens, notebooks, calculators, and glasses could be included to enhance the academic atmosphere and reinforce the theme of data analysis.